Compass Analysis
The Compass Analysis module displays the Compass dashboard inside a capture window. The Compass dashboard is an easy-to-use network monitoring tool for both wired and wireless networks. It is an interactive forensics dashboard that displays network utilization over time, including top protocols, flows, nodes, channels, WLAN, VLAN, Data Rates, Applications, and Countries. See Compass dashboard.
To change options in the Compass Options dialog:
1. On the menu, click, and then click .
2. Select Compass Adapter and click . The Compass Options dialog appears.
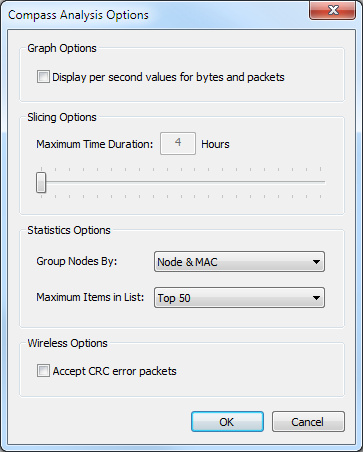
3. Configure the Compass Options dialog:
• Select Display per second values for bytes and packets if you would like per second values to appear.
• Use the Maximum Time Duration slider bar to set the ‘Slicing’ value. ‘Slicing’ refers to removing a portion of time from the beginning of the statistics database, thereby leaving the most recent data restricted to a maximum time duration. ‘Slicing’ only occurs during real-time captures.
NOTE: When the statistics database reaches a time duration equal to the maximum time duration + 10 minutes, Compass removes the first 10 minutes of statistics data from the database.
• Select from Group Nodes By:, the preferred method for grouping statistics in the statistic chart windows (Node & MAC, Node, or Mac).
• Select from Maximum Items in List:, the maximum number of list view items to display for statistic chart windows (Top 5, 10, 20, 50 or 100).
• Select Accept CRC error packets if you would like to also capture CRC error packets when capturing wireless packets.
4. Click to accept your changes.